openmaterials.ai / codes / pymatgen-analysis-diffusion
pymatgen-analysis-diffusion: diffusion analysis of ionic conductor trajectories
A pymatgen add-on for MD of ionic conductors: probability densities and van Hove functions, beside the MSD, Arrhenius and Nernst-Einstein analysis in pymatgen.
What it is and how it works
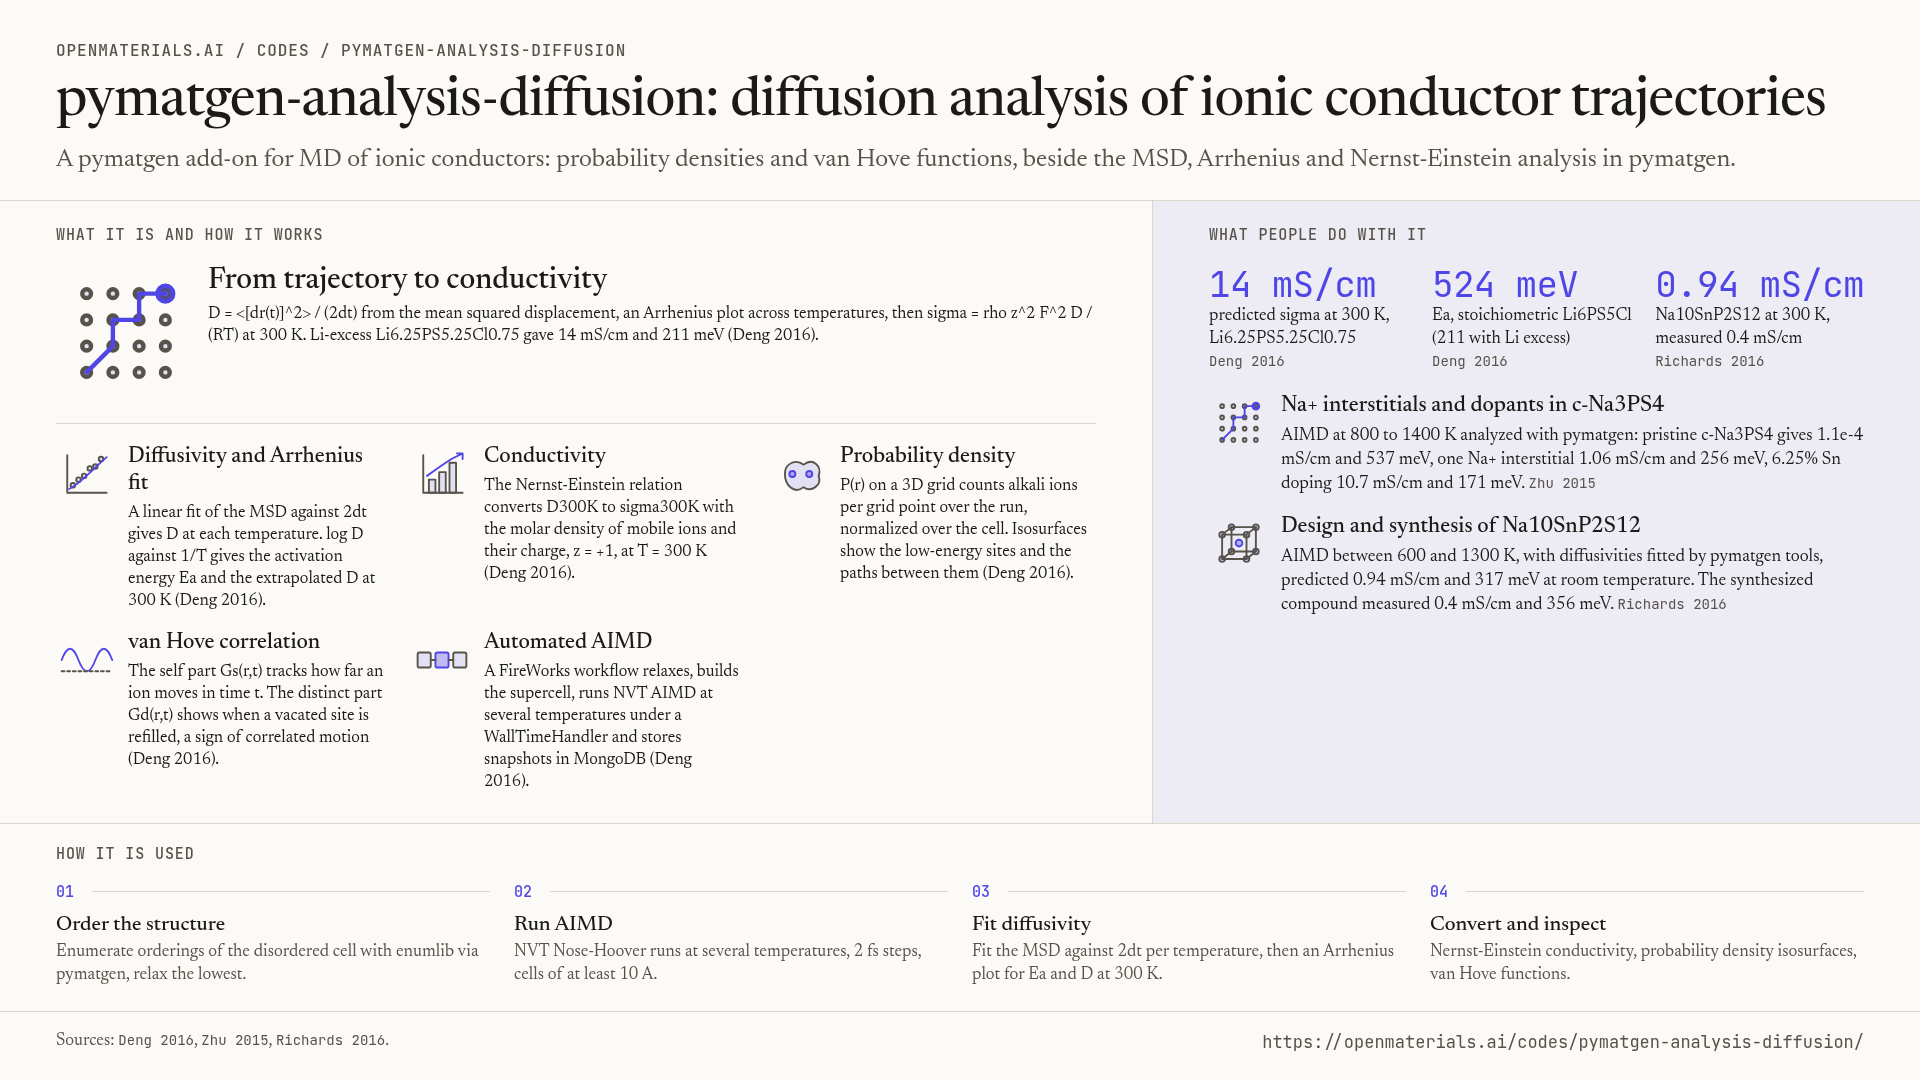
From trajectory to conductivity
D = <[dr(t)]^2> / (2dt) from the mean squared displacement, an Arrhenius plot across temperatures, then sigma = rho z^2 F^2 D / (RT) at 300 K. Li-excess Li6.25PS5.25Cl0.75 gave 14 mS/cm and 211 meV (Deng 2016).
Diffusivity and Arrhenius fit
A linear fit of the MSD against 2dt gives D at each temperature. log D against 1/T gives the activation energy Ea and the extrapolated D at 300 K (Deng 2016).
Conductivity
The Nernst-Einstein relation converts D300K to sigma300K with the molar density of mobile ions and their charge, z = +1, at T = 300 K (Deng 2016).
Probability density
P(r) on a 3D grid counts alkali ions per grid point over the run, normalized over the cell. Isosurfaces show the low-energy sites and the paths between them (Deng 2016).
van Hove correlation
The self part Gs(r,t) tracks how far an ion moves in time t. The distinct part Gd(r,t) shows when a vacated site is refilled, a sign of correlated motion (Deng 2016).
Automated AIMD
A FireWorks workflow relaxes, builds the supercell, runs NVT AIMD at several temperatures under a WallTimeHandler and stores snapshots in MongoDB (Deng 2016).
What people do with it
- 14 mS/cmpredicted sigma at 300 K, Li6.25PS5.25Cl0.75Deng 2016
- 524 meVEa, stoichiometric Li6PS5Cl (211 with Li excess)Deng 2016
- 0.94 mS/cmNa10SnP2S12 at 300 K, measured 0.4 mS/cmRichards 2016
Na+ interstitials and dopants in c-Na3PS4
AIMD at 800 to 1400 K analyzed with pymatgen: pristine c-Na3PS4 gives 1.1e-4 mS/cm and 537 meV, one Na+ interstitial 1.06 mS/cm and 256 meV, 6.25% Sn doping 10.7 mS/cm and 171 meV. Zhu 2015
Design and synthesis of Na10SnP2S12
AIMD between 600 and 1300 K, with diffusivities fitted by pymatgen tools, predicted 0.94 mS/cm and 317 meV at room temperature. The synthesized compound measured 0.4 mS/cm and 356 meV. Richards 2016
How it is used
Order the structure
Enumerate orderings of the disordered cell with enumlib via pymatgen, relax the lowest.
Run AIMD
NVT Nose-Hoover runs at several temperatures, 2 fs steps, cells of at least 10 A.
Fit diffusivity
Fit the MSD against 2dt per temperature, then an Arrhenius plot for Ea and D at 300 K.
Convert and inspect
Nernst-Einstein conductivity, probability density isosurfaces, van Hove functions.
What pymatgen-analysis-diffusion is
pymatgen-analysis-diffusion analyses molecular dynamics trajectories of ionic conductors: mean squared displacements, diffusivities, conductivities and migration pathways. On the map it serves the diffusion quantities it computes.
WebsiteRepositoryOn the mapAll codesLicense: BSD-3-Clause
In more detail
Diffusivity, conductivity and correlation functions
The diffusivity is D = <[dr(t)]^2> / (2dt), from a linear fit of the mean squared displacement against 2dt. Runs at several temperatures give an Arrhenius plot whose slope is the activation energy and whose extrapolation gives D at 300 K, which the Nernst-Einstein equation converts to a conductivity. The probability density P(r), defined on a uniform 3D grid and normalized over the cell, locates sites and migration paths. The van Hove function splits into a self part Gs and a distinct part Gd that reduces to the pair distribution function at t = 0. The probability density and van Hove analyses were implemented in the open-source pymatgen-diffusion add-on (Deng 2016).
Practical settings and automation
AIMD for superionic conductors runs in the NVT ensemble with a Nose-Hoover thermostat at fixed 0 K or experimental cell parameters, non-spin-polarized with a reduced cutoff. A 2 fs time step suffices, and cells of at least 10 A per side limit artificial correlated diffusion from periodic images. Runs take weeks, so a FireWorks workflow adds AIMD jobs per temperature and a custodian WallTimeHandler stops each job before the queue limit. Continuations resubmit until a maximum step count, a required MSD or a required R-squared of the MSD fit is reached. Snapshots and analyses go to MongoDB. With this setup more than 200 compositions were assessed in two years (Deng 2016).
Validation against measured conductors
For argyrodite Li6PS5Cl the stoichiometric cell gives about 2e-3 mS/cm and 524 meV. A Li-excess Li6.25PS5.25Cl0.75 cell gives 14 mS/cm (12 to 18 from the fit uncertainty) and 211 meV, about an order of magnitude above the measured total conductivity of 1.1 mS/cm. The authors list fit uncertainty, grain boundaries in the measured total conductivity and the single conventional cell as causes (Deng 2016). For Na10SnP2S12 the predicted 0.94 mS/cm and 317 meV compare with 0.4 mS/cm and 356 meV measured on the synthesized compound (Richards 2016). For Si-doped Na3PS4 the predicted 1.66 mS/cm compares with 0.74 mS/cm measured for 0.94Na3PS4-0.06Na4SiS4 (Zhu 2015).
What it computes on the map
5 quantities, drawn by tier with the data flow between them. Dashed boxes are intermediate quantities. Select one for its formula and the other codes that compute it.
Embed this submap
<iframe src="https://openmaterials.ai/m/c56731602651/0000000000100000000000001a80?embed=1" title="pymatgen-analysis-diffusion on the OpenMaterials map" width="100%" height="480" loading="lazy" style="border:1px solid #EBEBEB;border-radius:6px"></iframe>
Each quantity with the interface the representation records.
- ActivationEnergyfit_arrhenius (analyzer.py:877-897)ev
- CarrierDensityself.n / structure.volume, the n/vol factor of get_conversion_factor (analyzer.py:846-869)per_cm3
- DiffusivityDiffusionAnalyzer.diffusivity / get_extrapolated_diffusivity (analyzer.py:55,226)cm^2/s
- ElectricalConductivity[carrier=ionic]DiffusionAnalyzer.conductivity / get_extrapolated_conductivity (analyzer.py:338,846-869)ms_per_cm
- MeanSquaredDisplacementDiffusionAnalyzer.msd vs .dt (analyzer.py:920+)A^2
References
The code
The papers that describe the code; cite them when you use it.
- Z. Deng, Z. Zhu, I. H. Chu et al., Data-Driven First-Principles Methods for the Study and Design of Alkali Superionic Conductors, Chemistry of Materials, 2016. doi.org/10.1021/acs.chemmater.6b02648
Applications
Highly cited studies that cite the code, with a few picked by hand.
- S. H. Bo, Y. Wang, J. C. Kim et al., Computational and Experimental Investigations of Na-Ion Conduction in Cubic Na 3 PSe 4, Chemistry of Materials, 2015. doi.org/10.1021/acs.chemmater.5b04013
- Z. Zhu, I. H. Chu, Z. Deng et al., Role of Na + Interstitials and Dopants in Enhancing the Na + Conductivity of the Cubic Na 3 PS 4 Superionic Conductor, Chemistry of Materials, 2015. doi.org/10.1021/acs.chemmater.5b03656
- W. D. Richards, T. Tsujimura, L. J. Miara et al., Design and synthesis of the superionic conductor Na10SnP2S12, Nature Communications, 2016. doi.org/10.1038/ncomms11009
How to cite
I.-H. Chu, Z. Deng, H. Nguyen, et al., pymatgen-analysis-diffusion (pymatgen-diffusion add-on); method: Z. Deng, Z. Zhu, I.-H. Chu, S. P. Ong, Data-Driven First-Principles Methods for the Study and Design of Alkali Superionic Conductors, Chem. Mater. 29, 281 (2017)